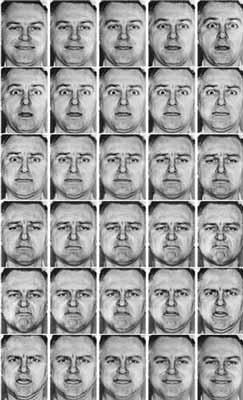
The Perception of Facial ExpressionsThe human face provides the most salient cue to another person’s emotional state. However, the vast majority of research in this area has focused on the communicative value of facial expressions, and few studies have investigated the perceptual processes preceding this stage. As a result, there is no detailed model of facial expression recognition. The following studies addressed the perceptual mechanisms underlying the recognition of facial affect, with a view to developing a model of facial expression processing. Categorical Perception of facial expressionsOur studies have shown that computer-generated continua ranging between two prototype facial expressions are perceived categorically. Hence, for a continuum ranging between sadness and anger, the images on one side are consistently identified as "sadness" and those in the other side as "anger", with a sharp boundary separating the two. Moreover, pairs of images that straddle the category boundary are more easily discriminated than pairs that lie within either side of the boundary. Facial expression MegamixBuilding on the findings of the previous categorical perception study we prepared all possible continua ranging between facial expressions associated with six basic emotions, happiness, sadness, anger, fear, disgust and surprise; this resulted in 15 separate continua each containing five physically equidistant steps (75 images in total. Figure 1 shows examples of these continua.
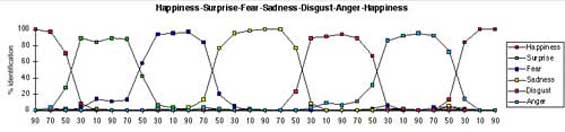
Participants were presented with these images in random order and asked to indicate whether each image was most like happiness, sadness, anger, fear, disgust, or surprise. The images in each continuum were consistently categorised as the emotion corresponding to the nearest endpoint expression; for example, images in the happiness-surprise continuum were labeled happiness if they were nearest the happiness endpoint and surprise, if they were nearest the surprise endpoint (see Figure 2). The images falling at the boundary region of each continuum was categorised as either of the two endpoints with approximately equal frequency. Importantly, this boundary image was not categorised as an expression other than the two boundary expressions.
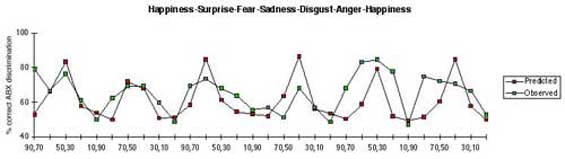
The pairs of adjacent images from Figure 1 were also used in an ABX discrimination task. The results showed that subjects found it easier to discriminate between pairs that straddled the category boundary between two expressions than pairs that fell within either side of the boundary (Figure 3).
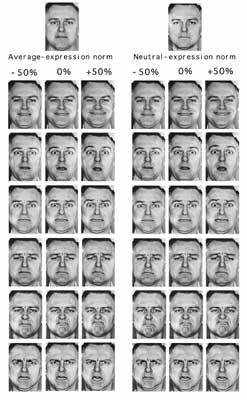
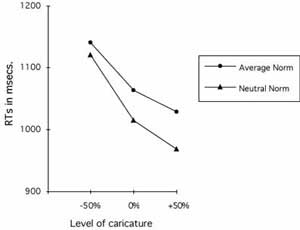
Caricaturing facial expressionsRecognitionPhotographic-quality caricatures of emotional facial expressions were generated by exaggerating the physical differences between a target expression (e.g., anger) and a reference norm face (e.g., a neutral expression or an average of all six expressions); 'anticaricatures' were produced by reducing these differences (Figure 4). Caricatured expressions were identified significantly faster than the original images used to prepare them, whereas anticaricatures were recognised significantly slower than the original images.
Figure 5: Participants' mean correct reaction times to identify the three levels of caricature (-50%, 0%, and +50%) prepared relative to neutral-expression and average-expression norms. Rated emotional intensityWhen subjects are asked to rate the emotional intensity of facial expressions caricatured at a number of different levels, emotional intensity shows a highly significant linear function with level of caricature. This pattern is found regardless of whether the reference face (norm face) used to prepare the caricatures shows a neutral facial expression, an average facial expression or another prototype expression (e.g., fear caricatured relative to an anger expression) (Figure 6)
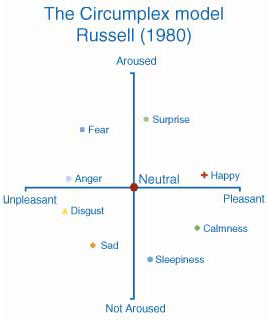
These results are difficult to reconcile with two-dimensional models of facial expression representation, such as Russell’s Circumplex model (Figure 7). This is because although these models can accommodate the effect of caricaturing relative to a neutral expression, they can not account for the fact that a facial expression's emotional intensity is enhanced when it is caricatured relative to any other facial expression.
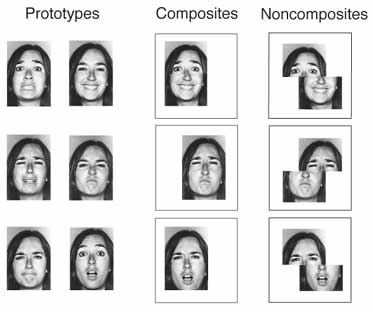
Configural coding of facial expressionsIt is well established that configural information (the relationships between facial features) plays an important role in coding a face’s identity (who the person is). However, its contribution to facial expression recognition is less well understood. In fact, some researchers have suggested that facial expressions are processed in a part-based (non-configural) manner (Ellison & Massaro, 1997). We have addressed this issue using a composite paradigm (Calder, Young, Keane, & Dean, 2000d). Our study showed that participants were slower to identify the expression in either half of ‘composite’ facial expressions (faces in which the top half of one expression (e.g., anger) was aligned with the bottom half of another (e.g., happiness) to create a novel expression configuration) relative to a 'noncomposite' control condition in which the two face halves were misaligned (Figures 8). These findings parallel the composite effect for facial identity (Young, Hellawell, & Hay, 1987). However, additional experiments showed that the identity and expression effects operate independently of one another; indicating that the configural cues to these two facial attributes are qualitatively different. This research complements the findings of the PCA (see below) which showed that identity and expression are represented by separate principal components. In line with this observation Cottrell (California, San Diego) and Calder have modelled these composite data in a PCA system (Cottrell, Branson, & Calder, 2002).
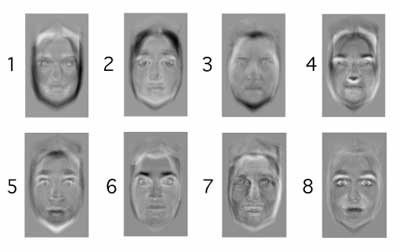
A Principal component analysis (PCA) of facial expressionsIt is generally agreed that facial identity recognition (who the person is) and facial expression recognition (what they are feeling) share the same front-end (perceptual) system. Previous research has shown that a principal component analysis (PCA) of the visual information in faces provides an effective front-end account of facial identity processing (Burton, et al. 1999). Hence, a critical question is whether PCA can also support the recognition of facial expressions. We addressed this by submitting the pixel intensities of pictures of facial expressions from the Ekman and Friesen (1976) series to a PCA (Calder, Burton, Miller, Young, & Akamatsu, 2001a). The results showed that PCA provides an effective means of coding the identity, expression, and sex of people’s faces (Figure 9). For facial expressions, the correct recognition rates and false positives derived from the principal components were well matched to human performance (Table 1). In addition, the model exhibited properties of two competing accounts of facial expression processing (dimensional and category-based models); providing a means of bridging-the-gap between, what were generally perceived to be distinct theoretical accounts. Finally, consistent with research showing that facial identity and facial expression recognition can be selectively disrupted, our research found that cues to identity and expression were coded by largely separate sets of principal components (Figure 10a&b). This research shows that linearised compact coding of human faces can provide a plausible account of the psychological data for both facial identity and facial expression processing.
| |||||||||||||||||||||||||||||||||||||||||||||||||||||||||||||||||||||||||||||||||||||||||||||||||||||||||||||||||||||||||||||||||||||||||||||||||||||||||||||||||||||||||||||||||||||||||||||||||||||||||||||||||||||
|
|
|||||||||||||||||||||||||||||||||||||||||||||||||||||||||||||||||||||||||||||||||||||||||||||||||||||||||||||||||||||||||||||||||||||||||||||||||||||||||||||||||||||||||||||||||||||||||||||||||||||||||||||||||||||
|
|||||||||||||||||||||||||||||||||||||||||||||||||||||||||||||||||||||||||||||||||||||||||||||||||||||||||||||||||||||||||||||||||||||||||||||||||||||||||||||||||||||||||||||||||||||||||||||||||||||||||||||||||||||
|
|
|||||||||||||||||||||||||||||||||||||||||||||||||||||||||||||||||||||||||||||||||||||||||||||||||||||||||||||||||||||||||||||||||||||||||||||||||||||||||||||||||||||||||||||||||||||||||||||||||||||||||||||||||||||
|
|||||||||||||||||||||||||||||||||||||||||||||||||||||||||||||||||||||||||||||||||||||||||||||||||||||||||||||||||||||||||||||||||||||||||||||||||||||||||||||||||||||||||||||||||||||||||||||||||||||||||||||||||||||
|
© MRC Cognition and Brain Sciences Unit aaron@mrc-cbu.cam.ac.uk zee@mrc-cbu.cam.ac.uk Contact Information | |||||||||||||||||||||||||||||||||||||||||||||||||||||||||||||||||||||||||||||||||||||||||||||||||||||||||||||||||||||||||||||||||||||||||||||||||||||||||||||||||||||||||||||||||||||||||||||||||||||||||||||||||||||